
Airports are going to run out of capacity due to the phenomenal growth of the aviation industry. We are confronted with this constantly. Still, the question remains: what can your organization do to meet the rising demand in the best way? BEONTRA can support you to identify the biggest capacity constraints right now, how the situation evolves in the future and how you can react to it in order to deliver excellence to your passengers in the most efficient way. This is where the new Capacity Demand Dashboard comes into play: it supports you to make better CAPEX investment decisions and to provide argumentation for strategic airport development decisions.
The two main input parameters are future (design day) schedules on the one hand and the airport’s infrastructure on the other hand. Either full seasons or peak day schedules can be utilized. Design days (usually 8th, 15th or 20th busiest days for a future season, or IATA defines the design day as the 2nd busiest day in an average week during the peak month) for each year are the most common option. The airport’s infrastructure includes current infrastructure, construction work schedule (and related down time of infrastructure) and future expansions.
Key Benefits:
- Easy to understand interpretation of large data sets trickling down to the decision-critical aspects
- All-In-One: from the high-level overview to the smallest detail in order to identify action items and be able to understand it and support decision making
- Fitting to your airport’s needs: every airport is different, graphics can be imported, areas and related infrastructure are highly configurable
BEONTRA combines software applications for forecasting and planning in the aviation industry with years of experience and gathered know-how and best practices in order to build products that support your journey to excellence and efficiency.
After having successfully conducted multiple projects in the field of capacity planning and engaged with our user community over multiple years, we have decided to complement the existing solutions by adding new functionality to successfully execute capacity studies and provide the decision support to make substantiated infrastructure investment decisions. This has been accomplished with the Capacity Demand Dashboard.
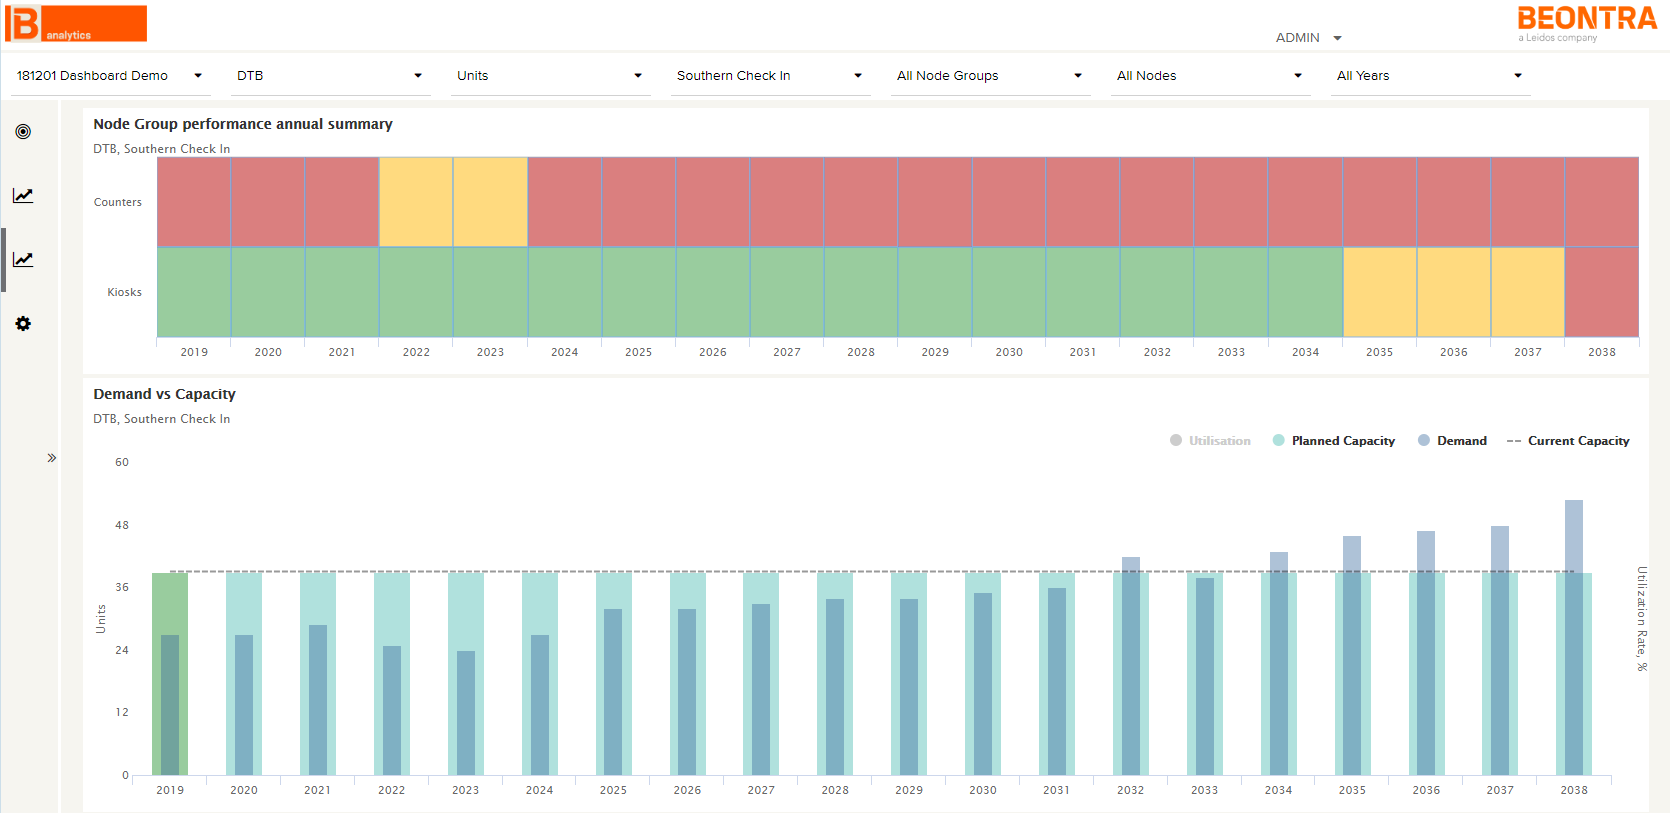
The Capacity Demand Dashboard is summarizing the relationship of the demand for your infrastructure and its capacity for up to 20 years. It enables you to identify when you are going to run out of capacity and when it is time to expand which part of the infrastructure. The Capacity Demand Dashboard delivers the results in a straightforward manner that is suitable to be presented to the decision makers, upper management and other relevant stakeholders. Colour coding aids interpretation of complex data results.
If you want to know more about this topic, please contact us.