IndiGo’s Bold Step into Long-Haul: Opportunities for Expansion to Europe 🌍✈️
As IndiGo prepares for its entry into the long-haul market, exciting developments are on the horizon. With plans to wet-lease six B787-9 Dreamliners from Norse Atlantic Airways starting in early 2025 and discussions to accelerate Airbus A350-900 deliveries, IndiGo is setting the stage to expand its network and offering non-stop connections to Europe.
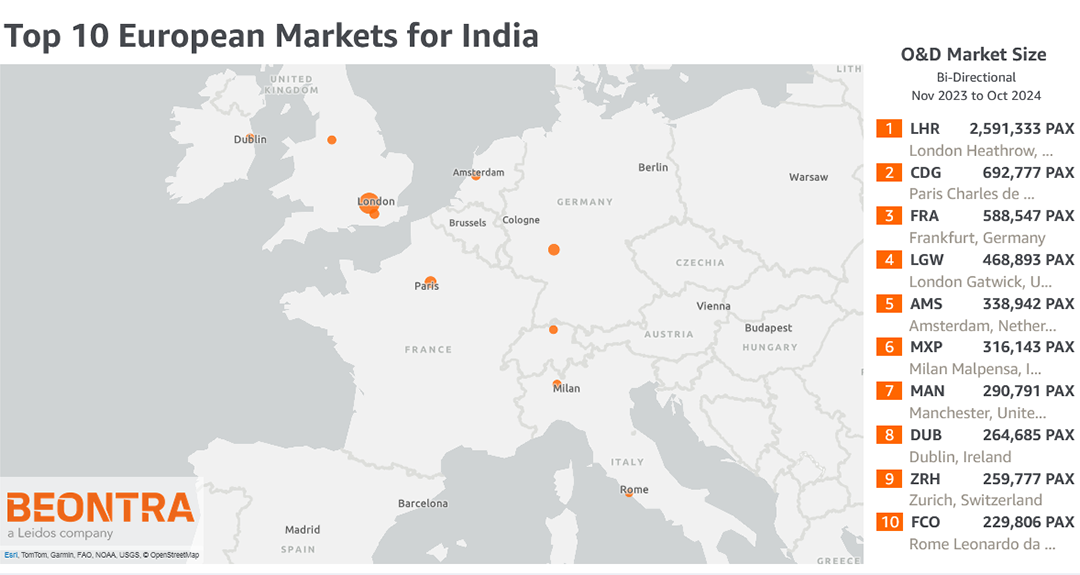
The initial deployment of the widebody fleet could include routes to London Heathrow (LHR) and Paris Charles de Gaulle (CDG) — two destinations identified as key priorities. Inspired by these news, we analyzed the O&D market sizes from India to European airports to uncover potential opportunities.
Here’s what we found:
London Heathrow, Paris Charles de Gaulle, and Frankfurt (FRA) lead the ranking, confirming their status as major hubs for India-Europe travel.
Interestingly, Manchester (MAN) and Dublin Airport (DUB) — ranked 7th and 8th respectively — currently lack non-stop flights to or from India, presenting a compelling opportunity for IndiGo or other carriers to establish new connections.
As IndiGo steps into the widebody game, its move into long-haul travel could address growing demand and strengthen ties between India and Europe, meeting the needs of both business and leisure travelers.
Which European destinations do you think should be next on IndiGo’s radar? Share your thoughts below!
To uncover untapped opportunities for your airline or airport, learn how BEONTRA’s Route Forecasting solution can support your network planning efforts: www.beontra.com/solutions.