We are happy to announce the 25th BEONTRA Summit! The BEONTRA Summit is an airport community meeting for planning experts and executives and, just like last year, will be held as a virtual event that runs in two individual sessions on October 27 and 28, 2021 – please...
Take charge of recovering your airport’s routes after the pandemic!
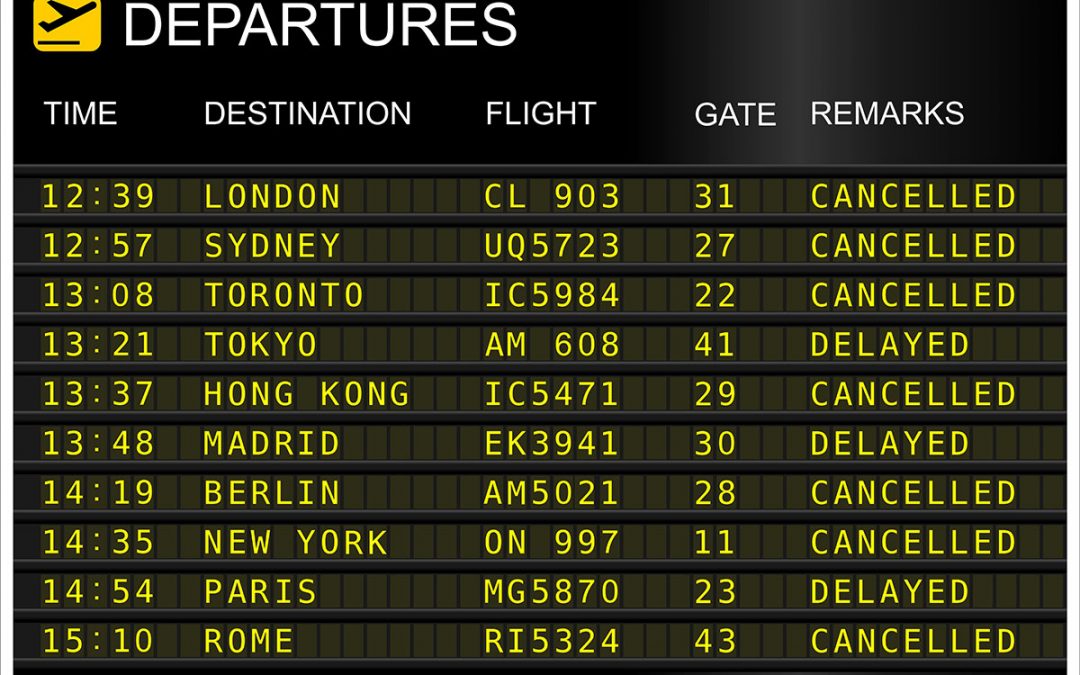
The current pandemic of the novel coronavirus has disrupted the aviation business. In a time where most airports are facing dramatic traffic drops or even a cease of operations, the immediate focus of route development has naturally shifted from developing eager opportunities to retaining and recovering existing routes.
Concentrate on the right routes for a successful restart
In this phase of uncertainty and unparalleled economic pressure…
- Airlines will concentrate on routes which have proven to be profitable in the past
- The discussion around incentives is likely to become more important than ever
- Airports and regional partners need to become more selective and spend their limited budget
in a way in which it pays off best.
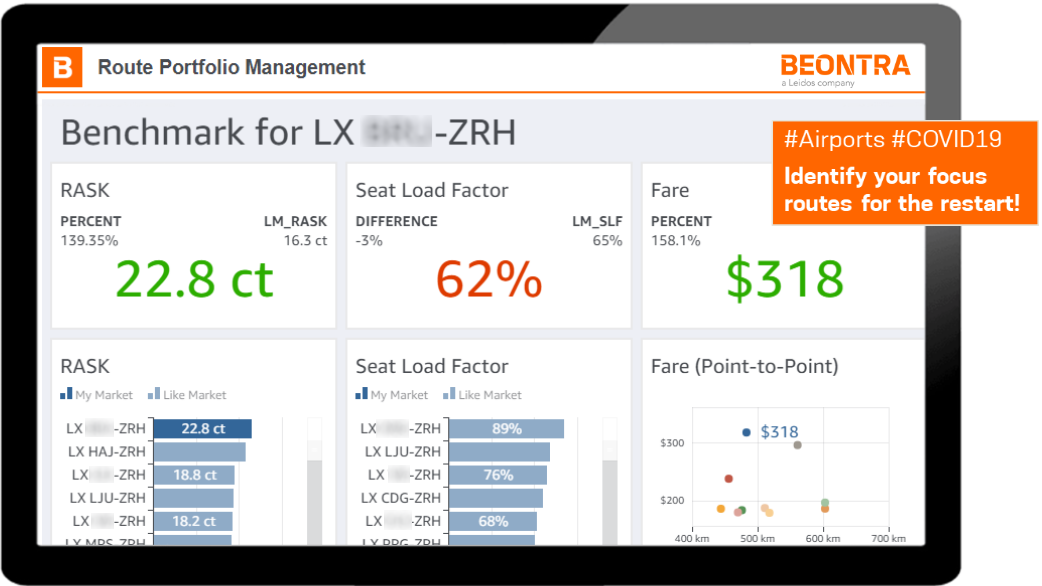
New BEONTRA feature enables airports to identify their focus routes
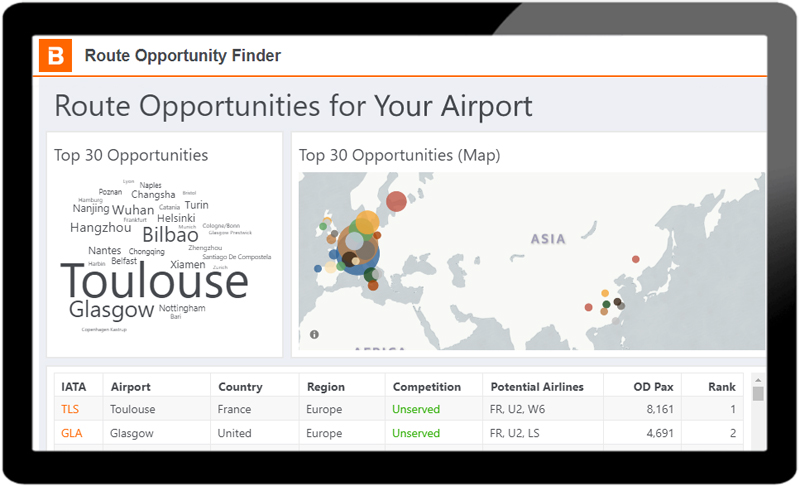
To support the activities of airports and their airline partners around a restart under the current circumstances, BEONTRA has released a cutting-edge feature to its B Route Development solution.
- The new Route Portfolio Management allows airports to adopt the airline’s perspective and benchmark their routes against similar airline routes using the main KPIs RASK, load factor, fare and yield.
- The solution combines BEONTRA’s know-how of aviation best practices with industry standard data sources, such as Sabre Global Demand Data, to provide airports with the relevant route performance insights in one place.
- The analysis results help airports identify focus routes and vulnerable spots and thus enable them to decide on which routes they should concentrate for the post-pandemic recovery.
Take charge of the recovery and start making data-driven decisions on the appropriate route development actions! Contact us today for a demo!
LATEST NEWS

Join us for the 25th BEONTRA Summit – Virtual Edition
read more
Meet us at FTE APEX Virtual Expo on 8 and 9 December 2020
We're excited to be a Gold Sponsor at FTE Apex Virtual Exhibition on 8 and 9 December 2020. During the two show days, we will be doing tailored demos of our forecasting and planning solutions, answer individual questions and demonstrate how our software can support...

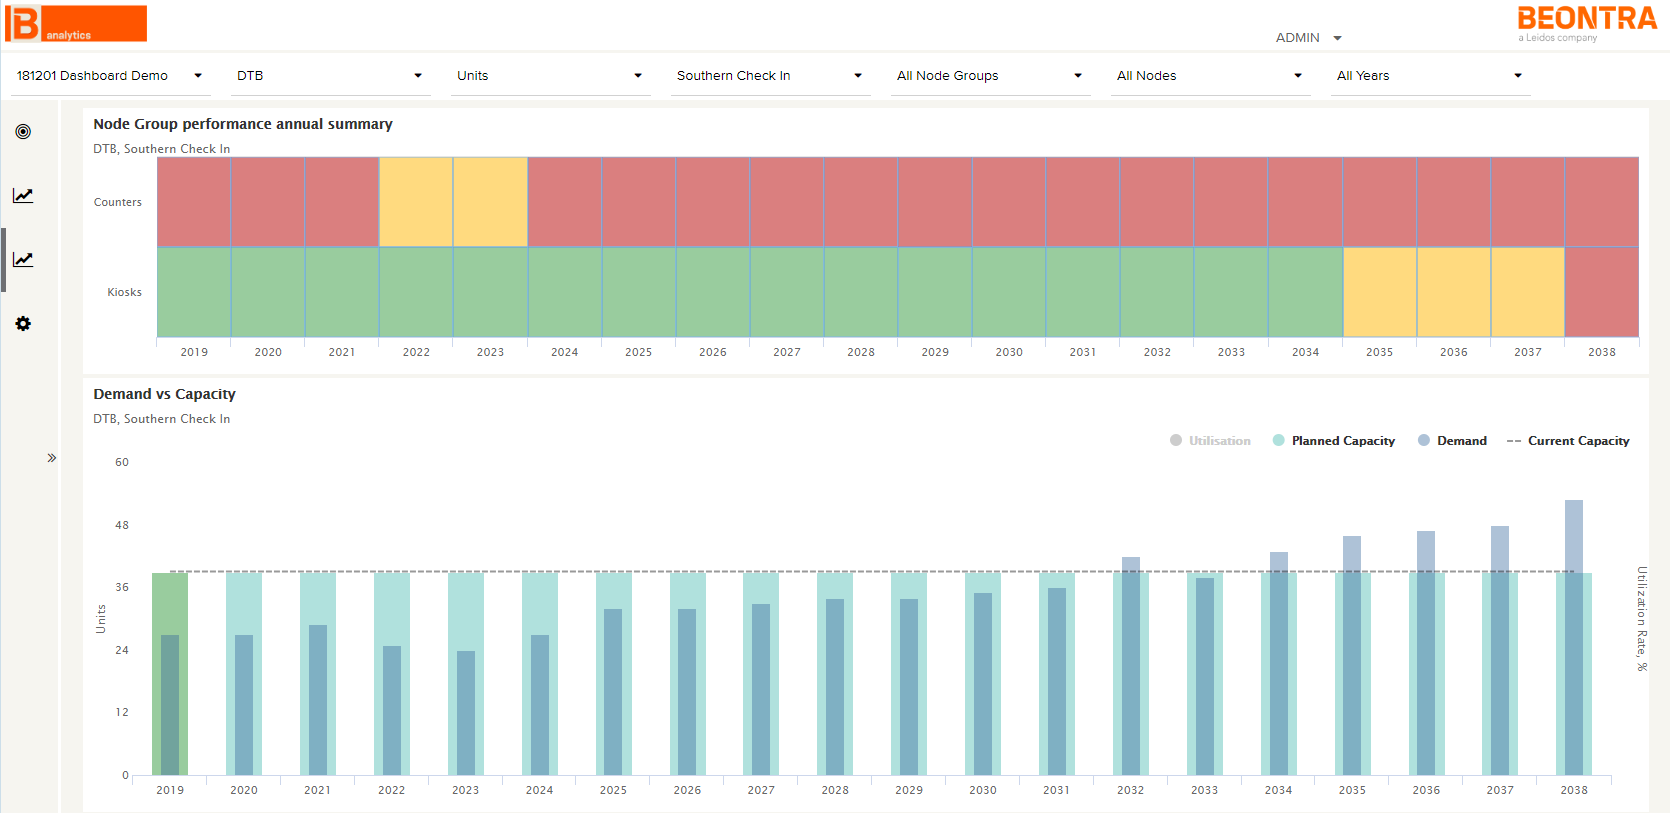
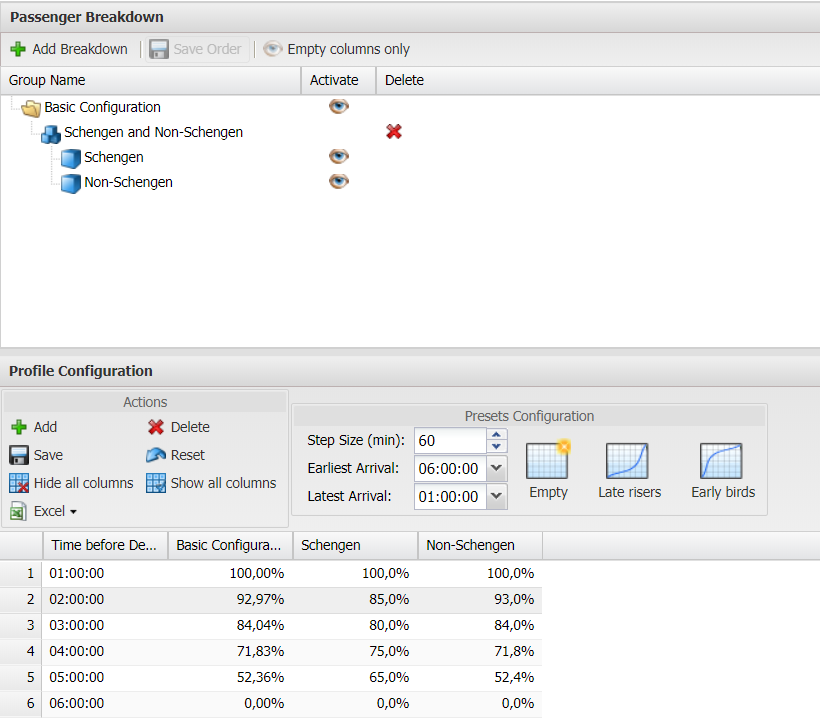
Whitepaper: How scenario planning of terminal operations supports the successful management of the COVID-19 recovery
In our latest webinar we discussed how scenario planning of terminal operations can support the successful management of the COVID-19 recovery. In addition to the recording we have created a free whitepaper to support your efforts. [download_after_email...